Pony stealer: a malware analysis - Unpacking the sample - Part one
During my day by day job, I had the chance to came across a mail that was blocked by an antispam platform. Attached to this mail there was a sample recognized as a variant of Pony Stealer malware. Since I've been greatly interested into malware analysis in the last few months, I thought it would be fun, and also a useful exercise, to apply all the notions I've been reading so far and writing this post, maybe, would help me in fixing methodologies and concepts. I hope this will be a two parts blog post: during this first part I will focus on unpacking the malware, during the second one I'll try to analyze its real behavior. Let's the journey begin.
Noob alert
First things first: I'm no expert at all. This is my first experience in reversing malware - and also in blogging something - and so expect a lot of shady things and confused assumptions. Learning something new is always a good idea and I hope that digging into malware analysis will allow me to glue together some skills that I'm trying to learn in the last couple of years. Also, do not rely on the memory addresses in the screenshots. As this post was written during various sessions, memory addresses changed every time due to operating system memory protections (ASLR).
Lab setup
You can find great tutorials online on how to setup a professional and secure lab to test all malicious sample you get. I'd like to point you out to these useful resources:
Running the sample into online sandbox
Since, right now, I don't have a working setup of Cuckoo sandbox on my behalf, the very first thing I did was uploading the sample into a freely usable sandbox online with these results: http://tinyurl.com/y9gspzmt. As you can see, it labels the sample as a variant of the VBObfus.g family. I didn't find a lot of informations about this malware family, but dynamic analysis shows me very few indicators:
- No evidence of malware activity into screenshot.
- No network activity.
- Every string is almost obfuscated.
- No extracted files.
- No evidence of process injection.
Important to note, although no clear evidences, the sample is classified as malicious with threat level as 71/100. Pretty strange, uh?
Hybrid Analysis has this great feature: if you click on the sample filename, in this case SKMBT_C36018060720040_pdf.exe, it shows a bunch of useful informations such as API calls used by the executable, registry keys it gets and/or sets during its runtime, filesystem activity, handles opened to files, operating system modules and other kind of libraries it uses. With all these informations we should have a proper level of confidence of what happens during the sandbox run. Let's dig into some of them.
First thing I looked at, was the activity on the filesystem:
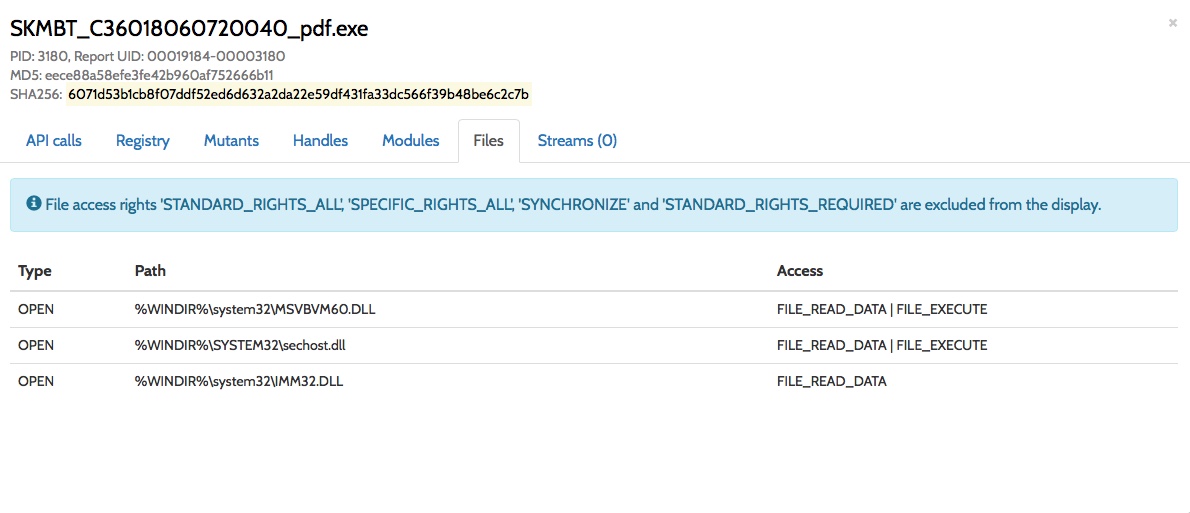
No files saved and the infamous msvbvm60.dll caught my attention, but we will deal with this later. Nothing too much interesting into registry section too:
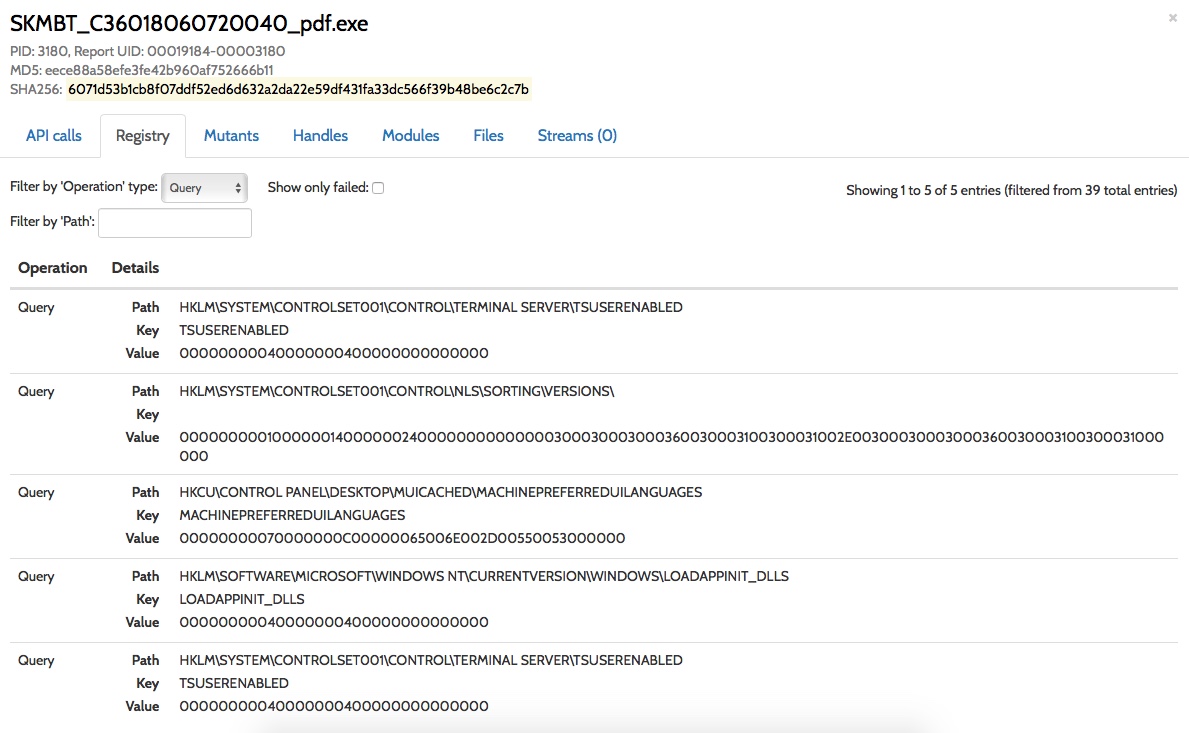
There's a possibility to filter the operations (Query, Open, Write and Delete) but I didn't find anything related to write or delete operations.
The most interesting section is the API calls section. To understand the malware behavior during its run inside the sandbox, it's necessary to analyze what API this sample calls. Following this and this useful resources, I started checking API calls, trying to find any evidence of anti-debug or anti-vm techniques, mainly because there's no evidence of process injection and nowadays process injection is a very, very common technique. After checking all API anti-debug calls found in documentation I was clearly missing something because I wasn't able to find any of them. So it's time to give it a run into my lab and observe its behavior.
Static analysis
Before give it a run, let's check with some basic tools how's the file is built:
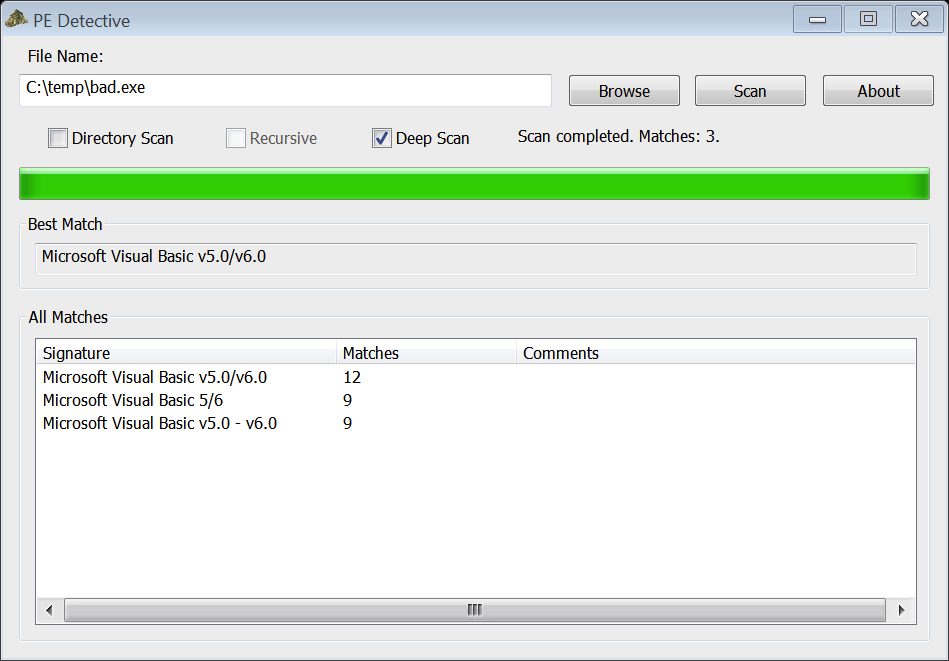
So, really we're dealing with a VisualBasic 5/6 executable file.
Let's dig into more details with the executable:
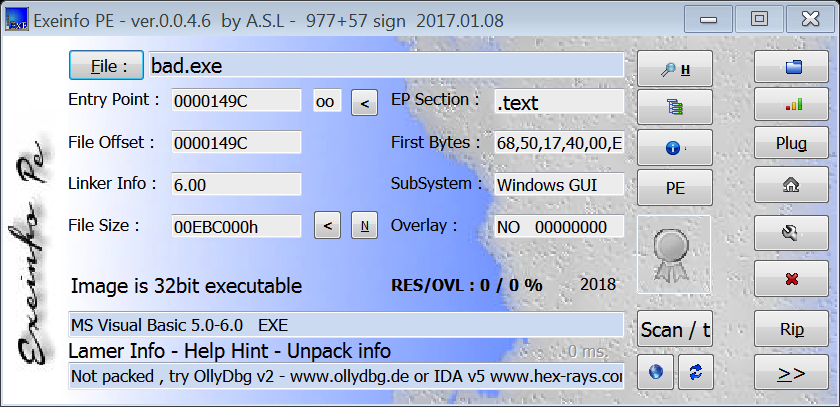
With this great tool we can find some initial informations:
File Version Info Size=1548 -> 060Ch
Translations : 040904B0 Language : English (U.S.) - ( 0 4 0 9 )
CompanyName = NIrSOft
FileDescription = ELEctrum
FileVersion = 6.02
InternalName = Bulbotuber
LegalCopyright = LAVasoft
LegalTradeMarks = THE ERAser PROject
OriginalFilename = Bulbotuber.exe
ProductName = ASUs
ProductVersion = 6.02
Comments = Pwa, INA.
Don't know how useful these informations are but, anyway, it's always better to have informations rather than nothing. Assumed that it's a VB5/6 executable file and I don't know how to deal with it inside IDAPro, my next action will be to run it inside my Analysis VM, with the intent to understand better its behavior.
Dynamic analysis
Interestingly it seems to me that, after some sort of unpacking in memory, there is clearly a process injection:
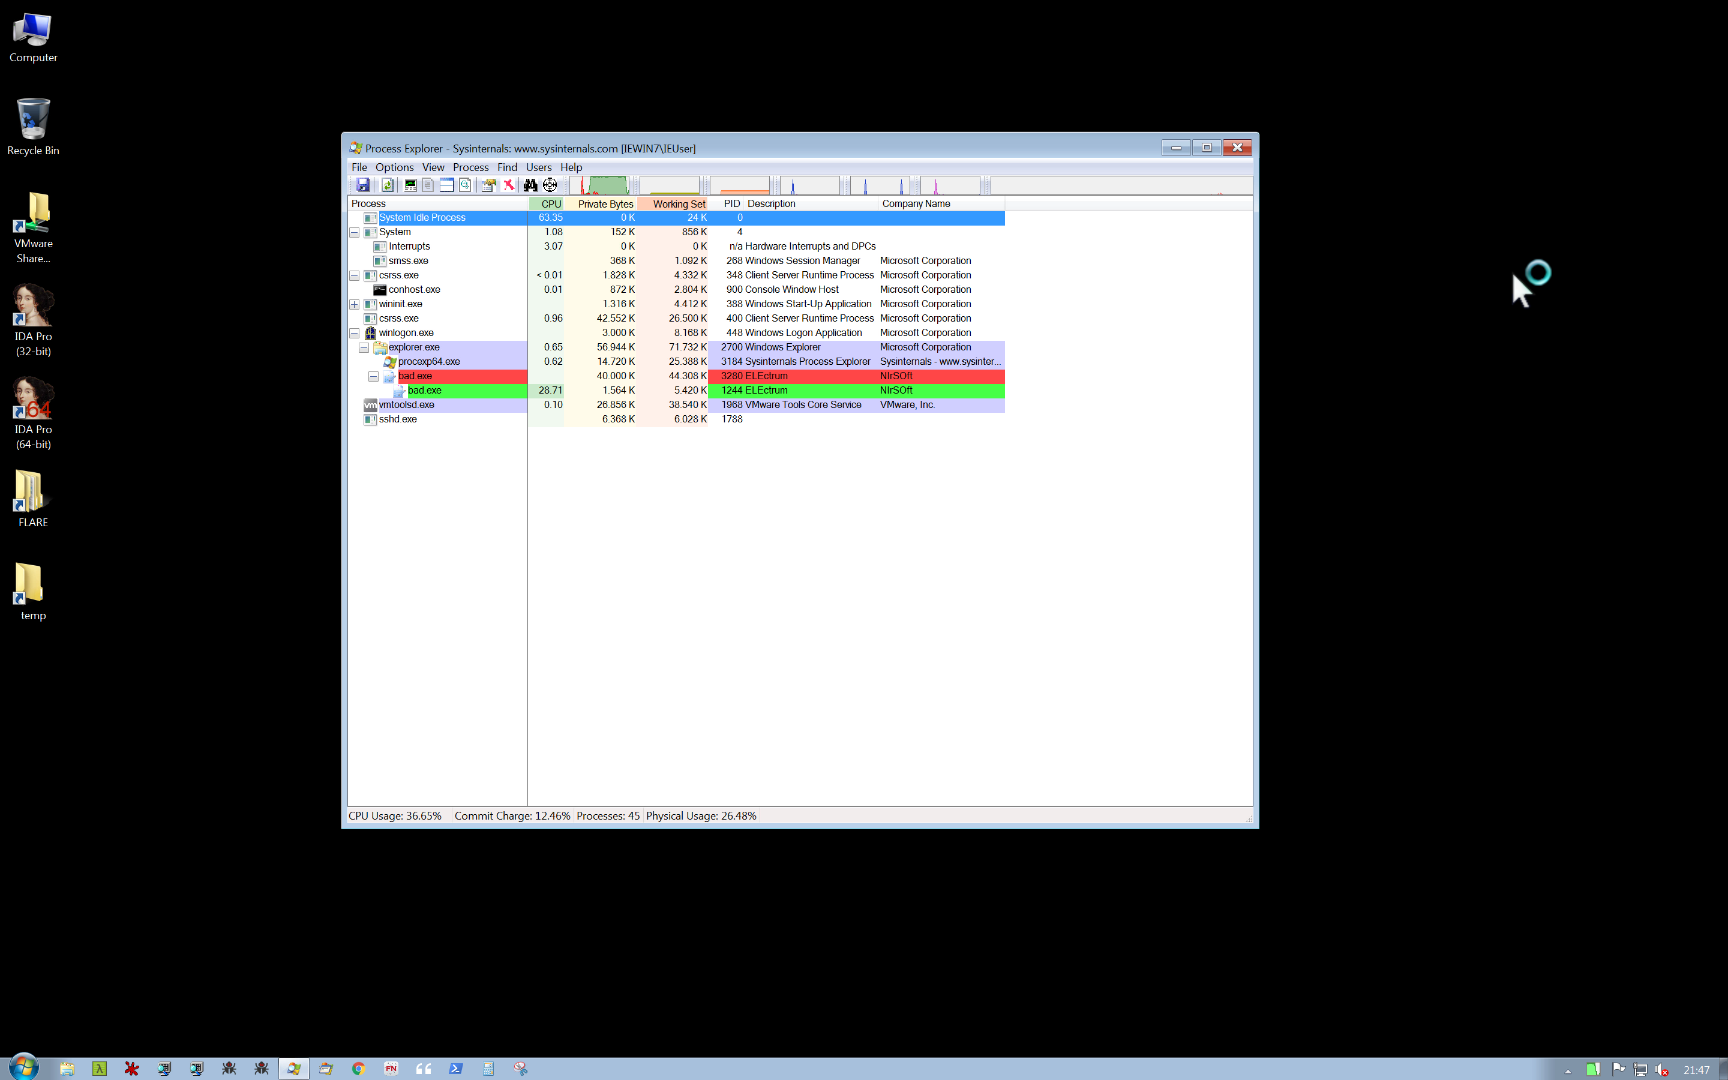
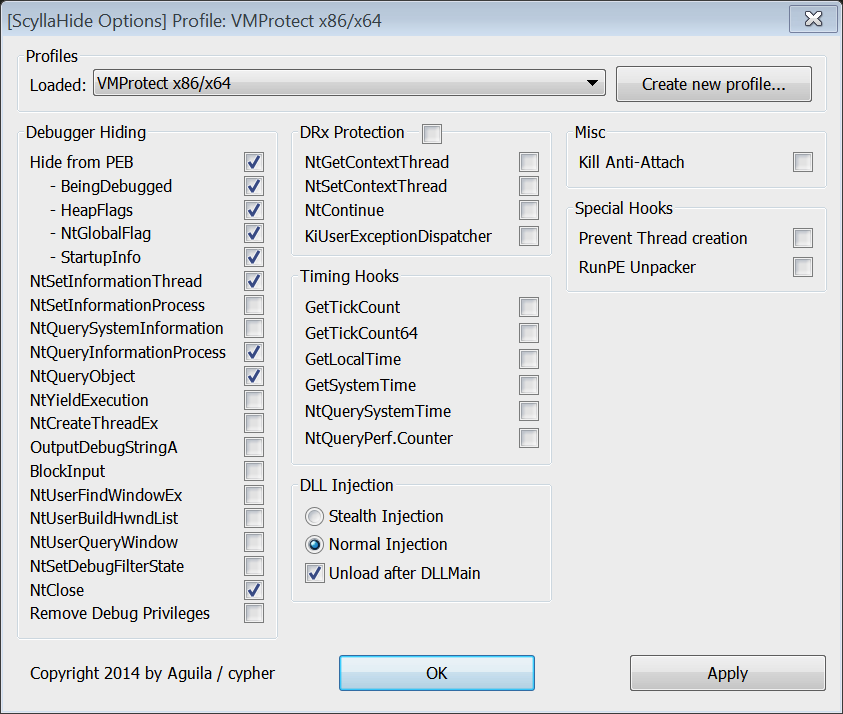
Apparently there must be in place some sort of anti-debug and/or anti-vm tricks. Easily enough in x32dbg there is a life-saving plugin, named ScyllaHide, that is capable of doing some black magic to hide the debugger from malware. We can avoid the process crashing during its run inside the debugger.
We can observe that the sample creates another process with the same name - a copy of itself - and this is typically an indication of the process hollowing.
I won't dig into describing the process injection because there are some great guys that have created very complete and clear tutorials on how to approach this technique. I can suggest this site maintained by this great guy: Sergey and also his Youtube channel here. I strongly suggest to follow all of his videos and tutorials: they are a great way to learn malware analysis and unpacking.
Unpacking the malware
To unpack the malware we'll focus mainly on these three API calls:
New process creation
First API call to breakpoint into debugger is kernel32.CreateProcessW, that creates a new process and its primary thread (cit. Microsoft). We're interested in its syntax:
BOOL CreateProcessA(
  LPCSTR                lpApplicationName,
  LPSTR                 lpCommandLine,
  LPSECURITY_ATTRIBUTES lpProcessAttributes,
  LPSECURITY_ATTRIBUTES lpThreadAttributes,
  BOOL                  bInheritHandles,
  DWORD                 dwCreationFlags,
  LPVOID                lpEnvironment,
  LPCSTR                lpCurrentDirectory,
  LPSTARTUPINFOA        lpStartupInfo,
  LPPROCESS_INFORMATION lpProcessInformation
);
And more interestingly, its structure on the stack when its called:
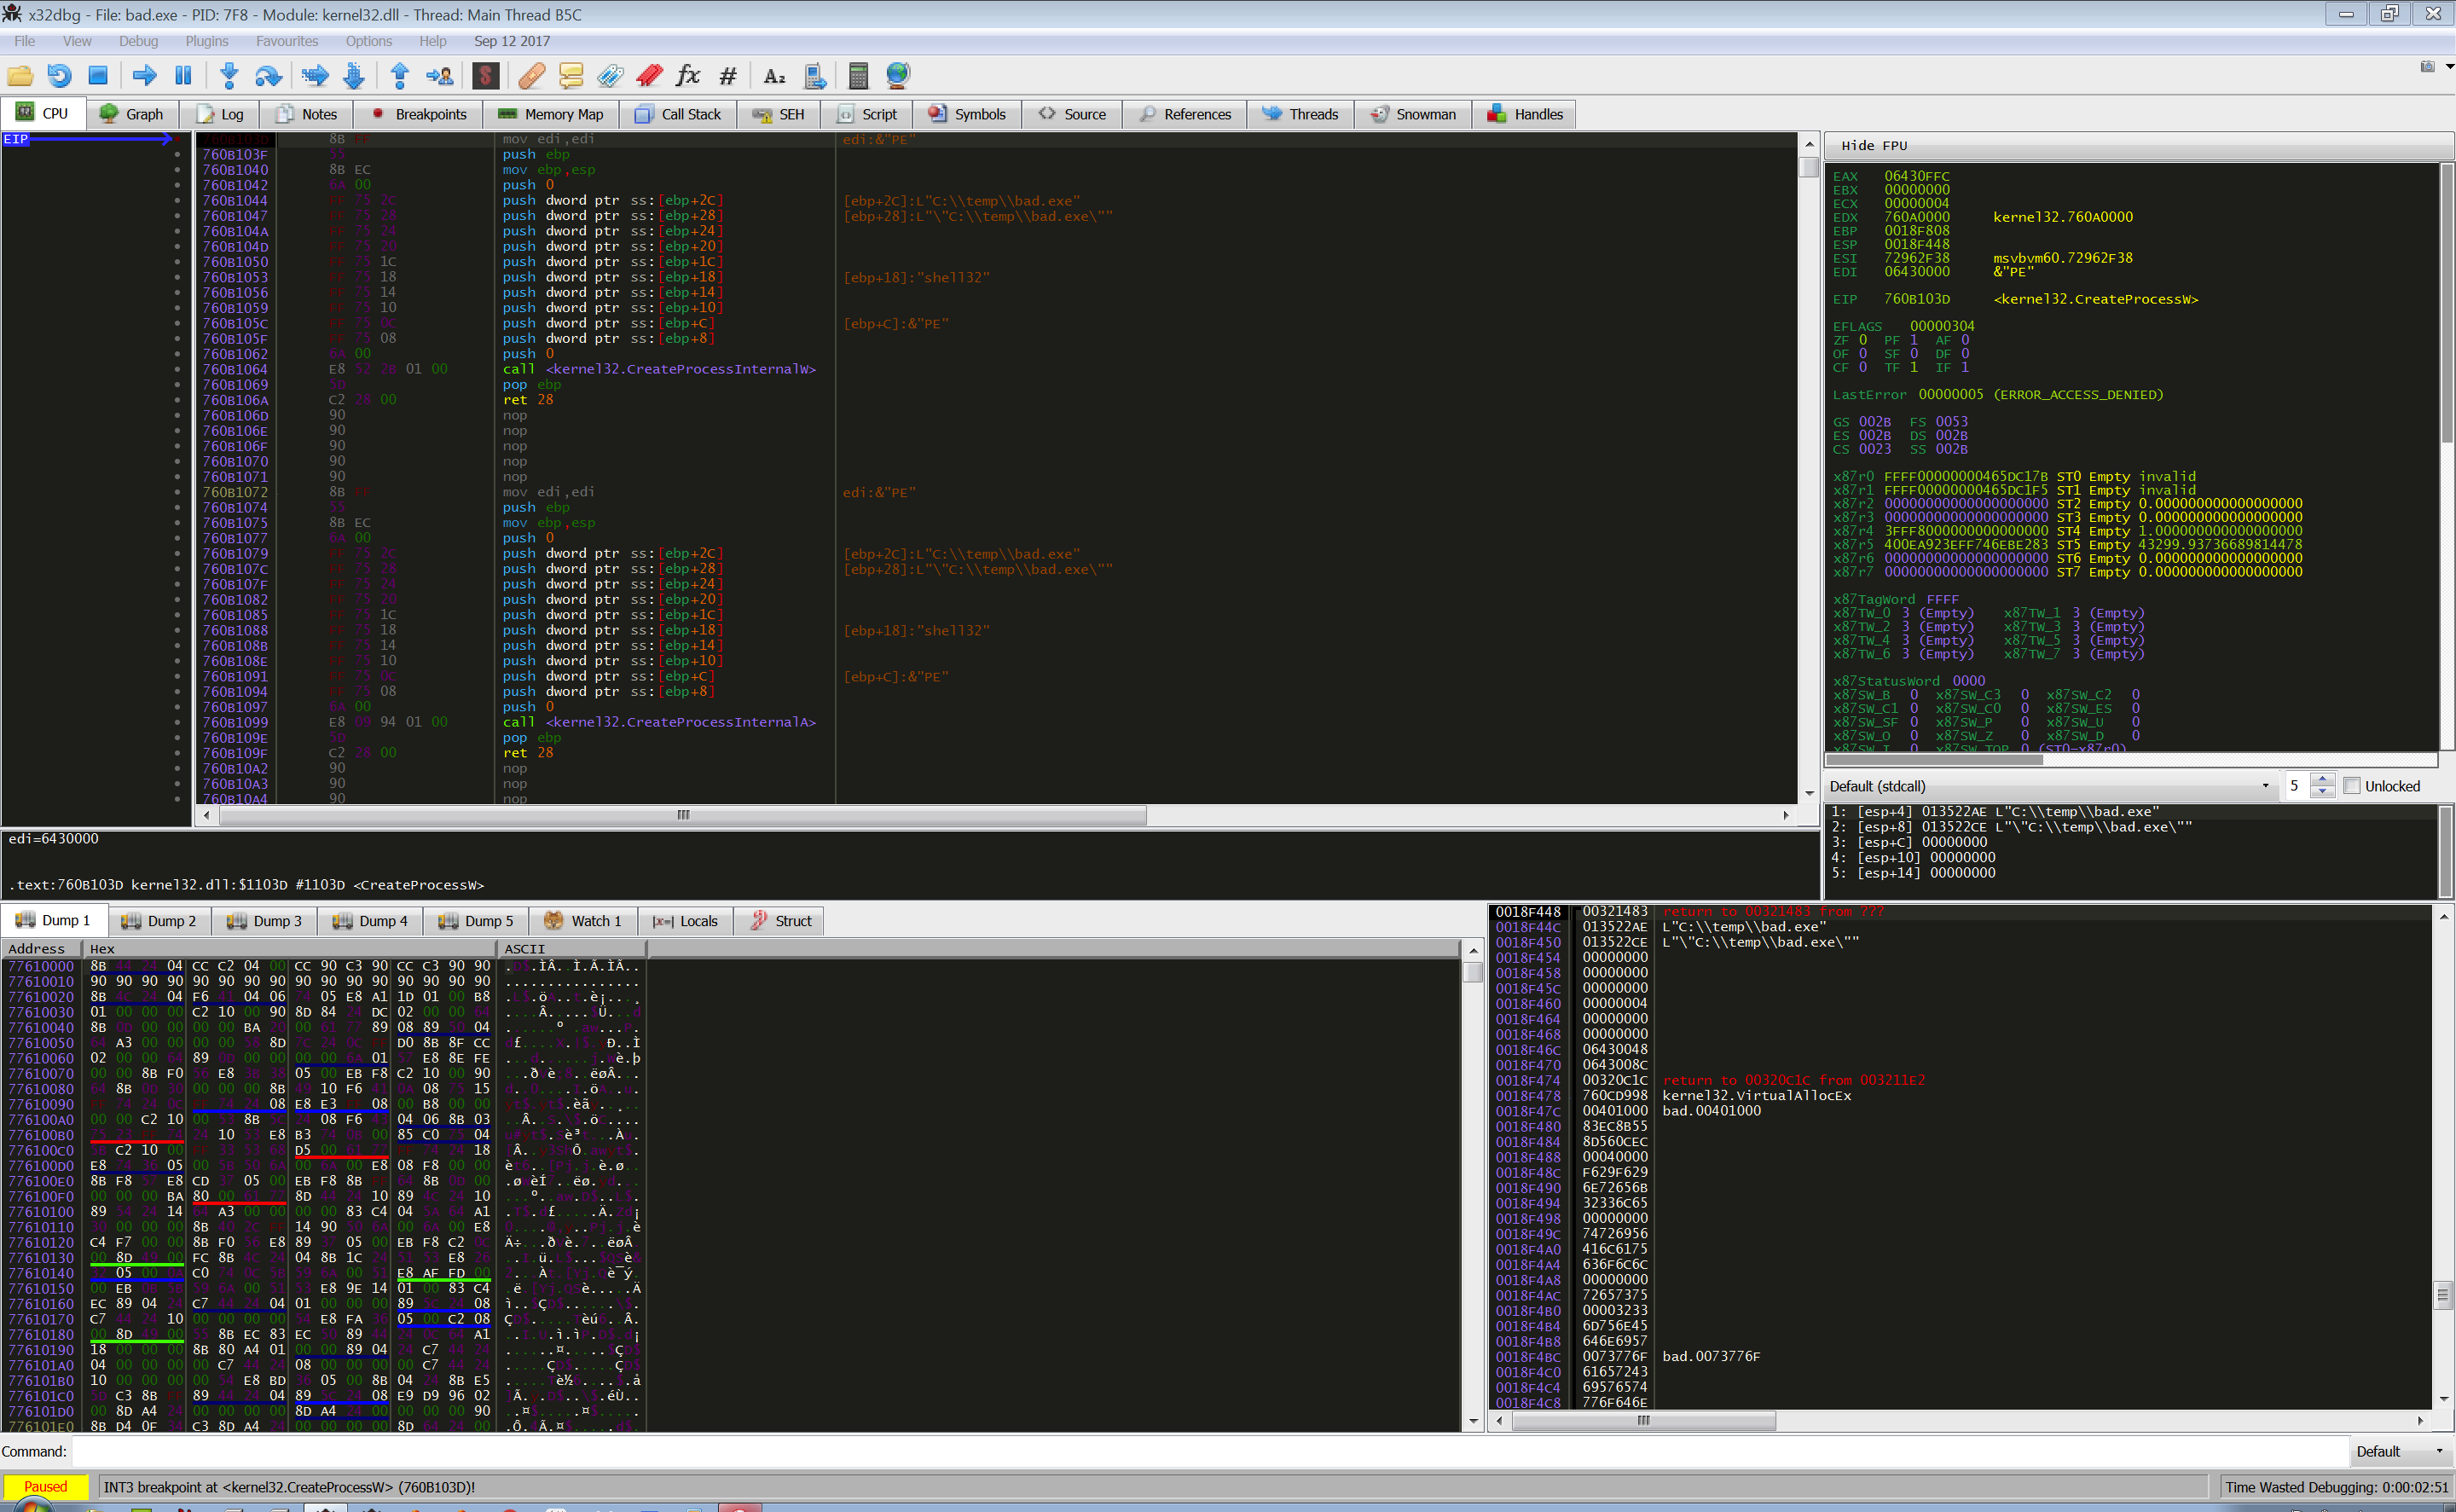
In accordance with the calling convention the function parameters are pushed on the stack in reverse order. At address 0x0018F460 there's the function fifth parameter dwCreationFlags, with the value of 0x00000004. This value means CREATE_SUSPENDED; we have reached the start of the hollowing process: a new copy of the process has been created in suspended mode.
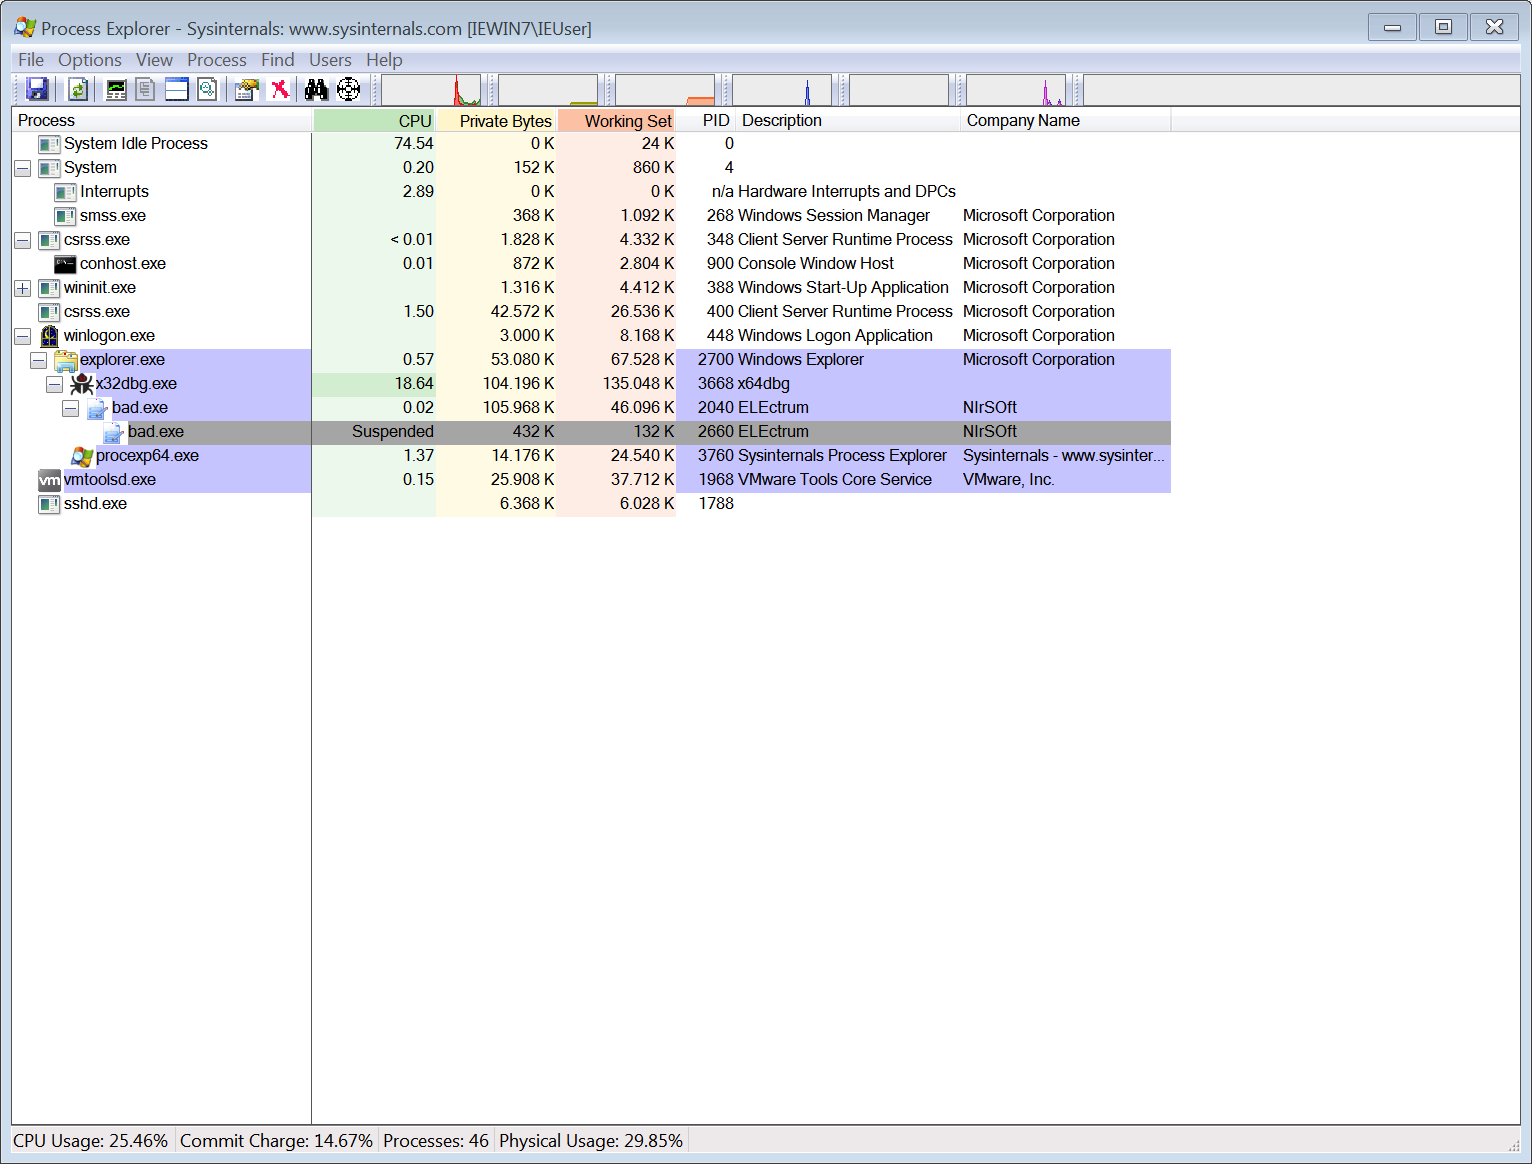
We can confirm its PID 2660, running the function CreateProcessW until it returns and checking in memory dump the value of the first parameter pushed on the stack at address 0x0018F470 with the value of 0x0643008C:

The new process PID is at address 0x06430094: 0x0A64 that translate into decimal in 2660.
Running the newly created process
We won't bother too much with ntResumeThread API call. Just note that when you reach breakpoint on this call, you know that the malware is ready to run itself (the new copy of itself actually) and, for this reason, you need to be very caution. Just don't let this call run because you're executing the malware itself.
Unpacking the malware
The interesting part: this API call let us to dump the hidden payload stored inside the malware. So, breakpoint on it and let the malware run until it reaches the breakpoint. As before:
NtWriteVirtualMemory(
  IN HANDLE               ProcessHandle,
  IN PVOID                BaseAddress,
  IN PVOID                Buffer,
  IN ULONG                NumberOfBytesToWrite,
  OUT PULONG              NumberOfBytesWritten OPTIONAL );
Basically we're interested in two arguments, in particular: the BaseAddress and the Buffer. These two parameters tell us where the buffer (the malware payload) will be written inside the newly created child's memory. During its run, the malware makes a lot of calls to this function and I single stepped all of them: when breakpoint is reached, analyze the stack:
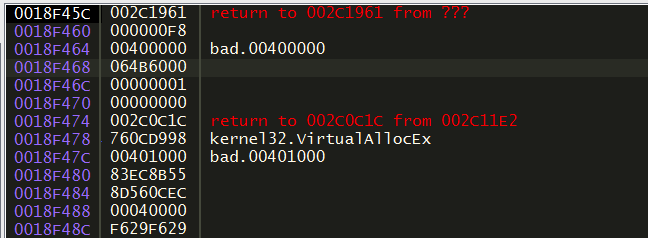
Focus on the third argument: 0x064B6000 and follow it into the memory dump:
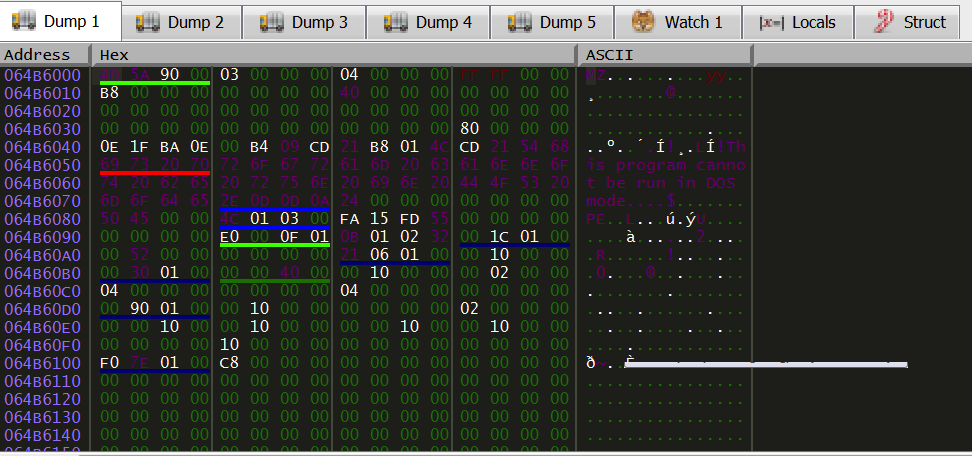
It seems we found something interesting, uh? :-)
We found that a PE file will be copied inside a memory address. Easy to dump it, right now: right click on to that address and follow it into memory map and after that dump that segment into a file.
So we have dumped an entire segment into a bin file. We can open it with an hex editor, scroll down until we reach the start of PE file (MZ magic bytes) and clear all junk from MZ to the beginning of the dump. Save to a new exe file and we're ready to open it with another great tool made by hasherazade: PE Bear. Luckily for us, IAT (Import Address Table) was not corrupted and we can see all the API the (real)malware calls when it runs.
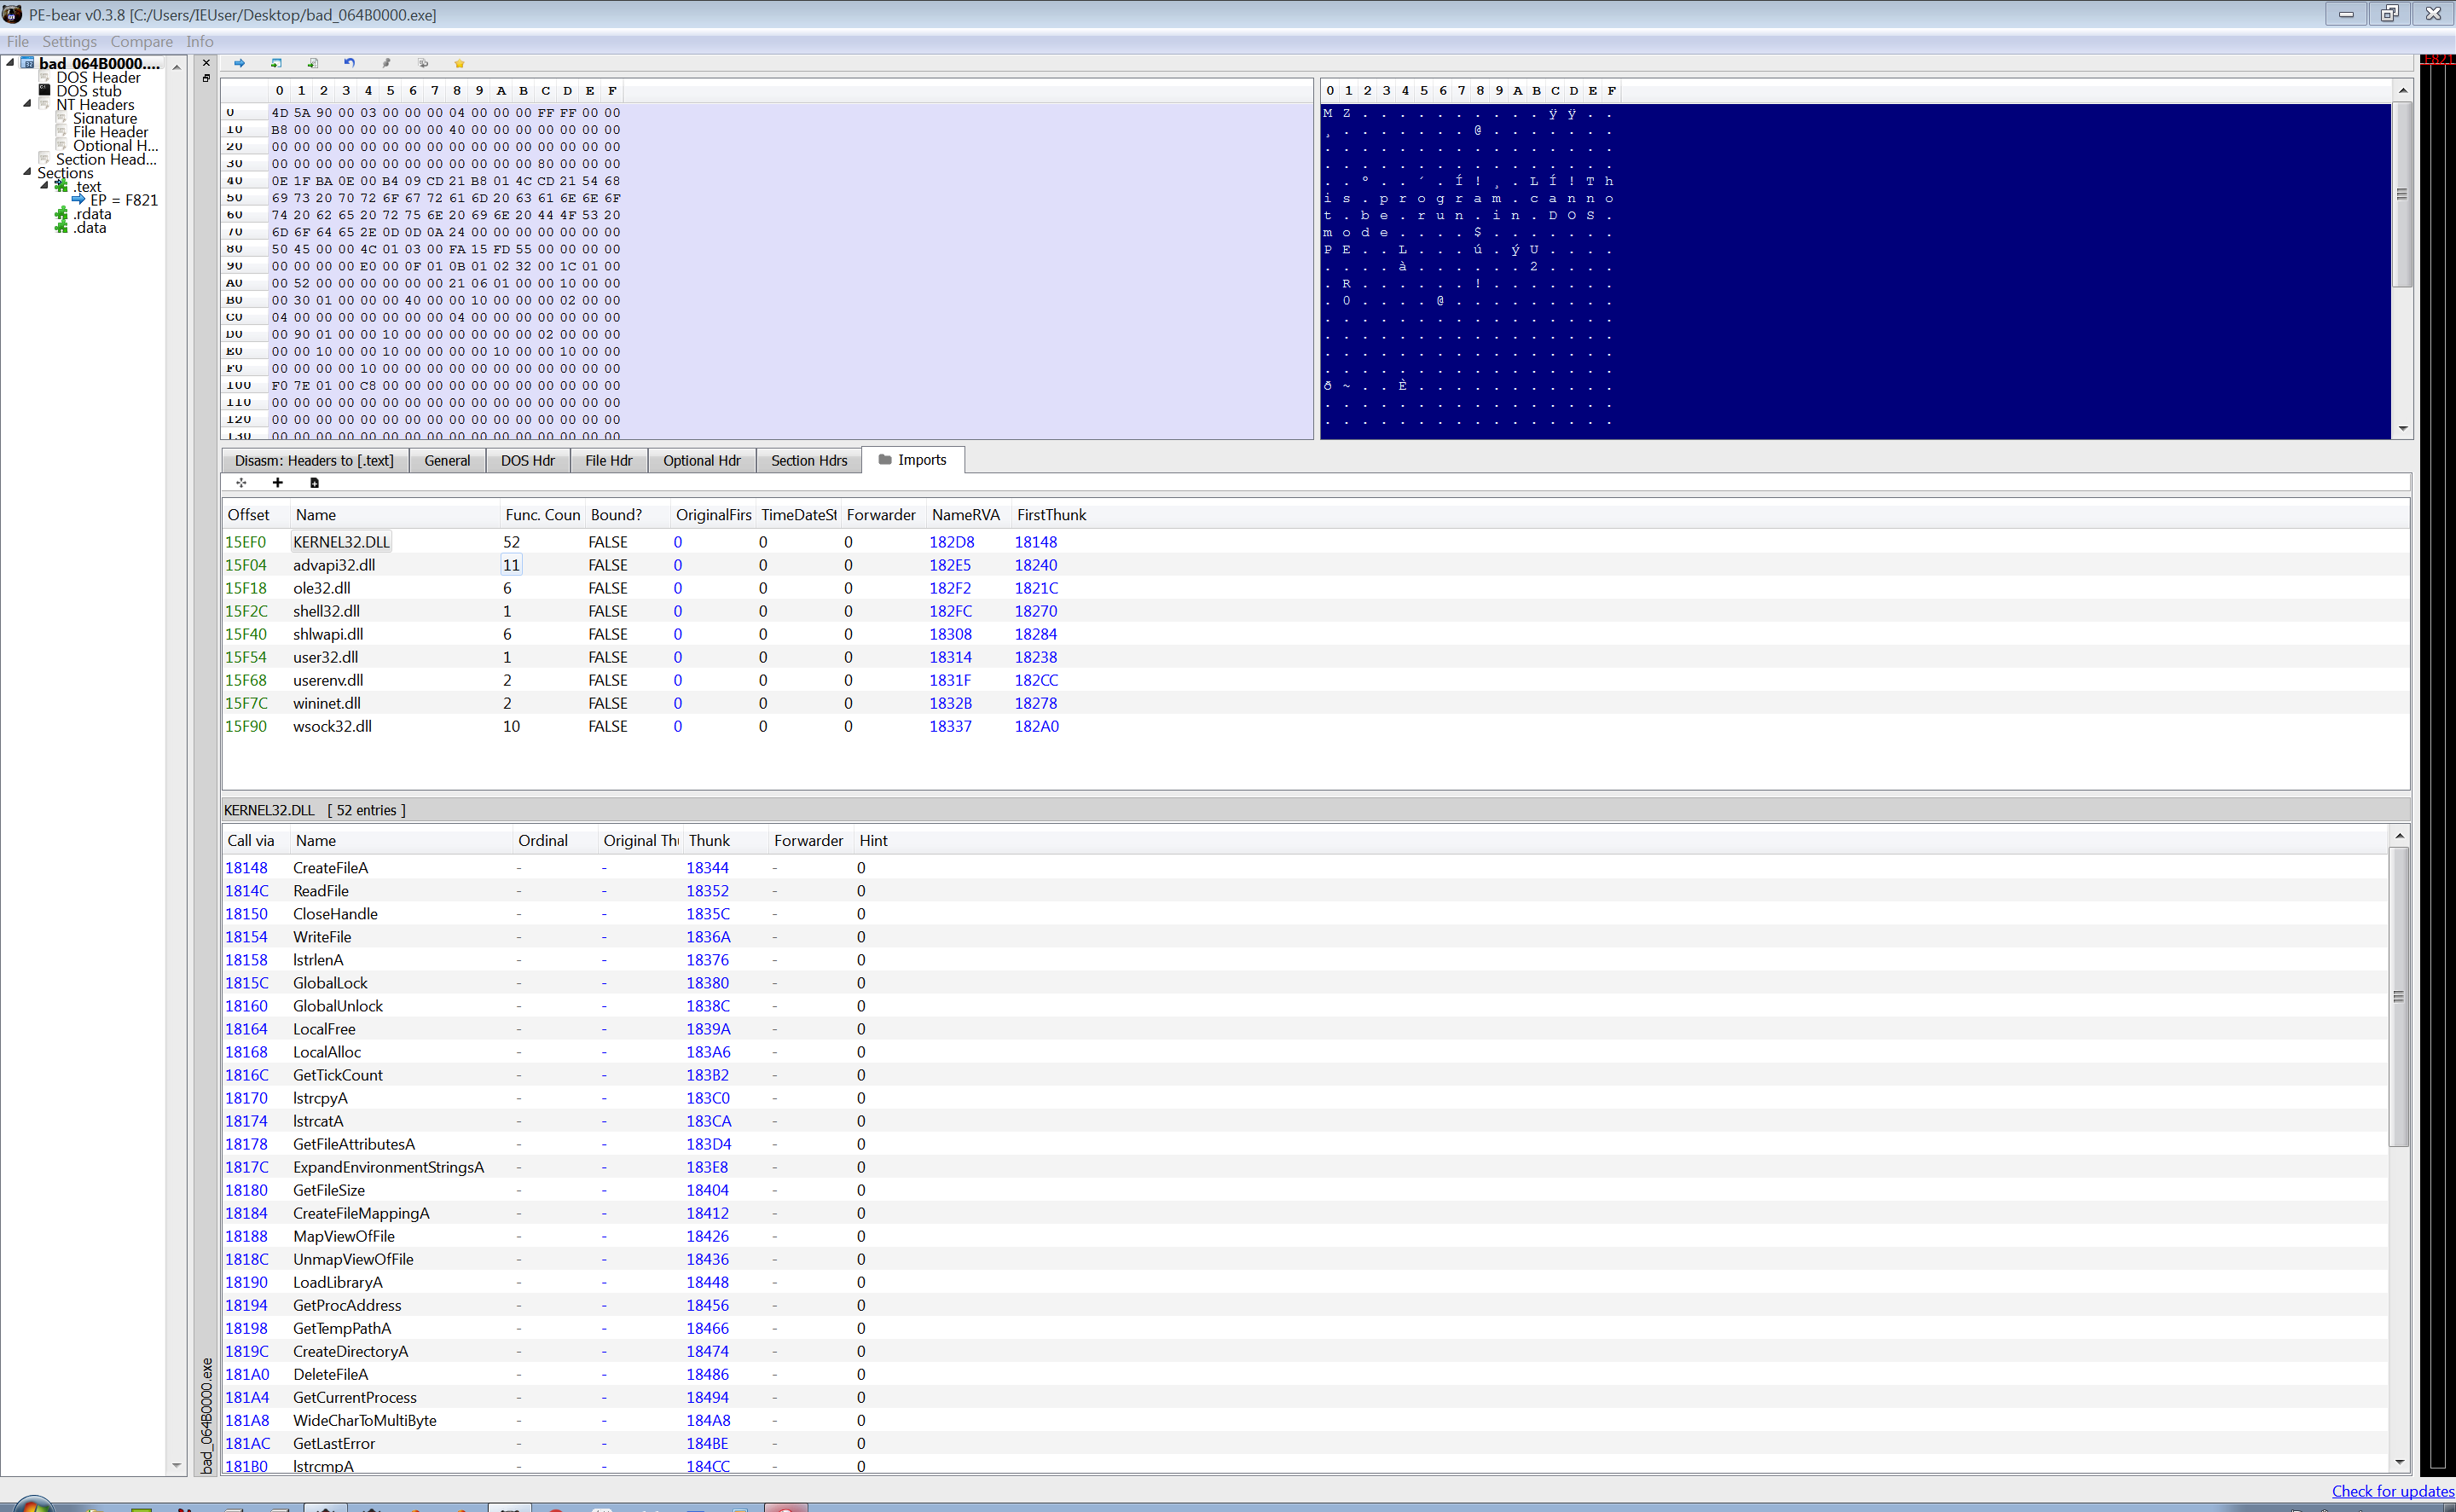
Basically we have unpacked the malware.

I will try to update this post with the second part as soon as I'll figure it out. :-)